
CAA Niagara has been serving Members in the Niagara Region for over 100 years. They have been a user of the AXIS system and all three of its major components (Member Relationship Management (MRM), Travel, and Road Service) for the past 21 years.
Until now, CAA Niagara’s business leaders have relied on pre-defined reports within AXIS and their IT department to generate new reports. It would take time for IT to deliver a new report and they would often need to explain outlying results before the report could be fully utilized.
To deliver information more effectively, Kevin Ruthven, Director of IT, decided to invest resources into putting in place a new and improved reporting solution. The solution would provide the business a self-serve environment where they could slice and dice the information to provide broader and deeper insights into their operations.
Getting Started
CAA Niagara’s first step was to create a data warehouse. They signed up for the AXIS BI Support service, which provided them with an easy way to populate their SQL data warehouse with over 8,000 fields of AXIS data that they had collected over several years.
Using AXIS data and other sources, CAA Niagara has accumulated a considerable amount of information. They needed to choose the right tools to bring it to life. The club decided on Microsoft Power BI® and hired a consultant to help them kickstart the process and set up the infrastructure, train users, and impart best practices.
After deciding on the Power BI solution, the next step for the club was to figure out what reports would be useful to produce. To start, they settled on two report categories:
- High-level dashboards with KPIs that management can access from their desktop or mobile devices, allowing them to take the pulse of the company at a glance. This includes actual versus target goals for a variety of KPIs, including financial information, renewal rates, membership counts, etc.
- Multi-dimensional reports by business line. These reports are meant to display information within different business lines in ways that allow the club to measure and analyze what they are doing.
Creating Reports for Business Lines
Membership Rewards and Road Service were the first areas of the business to embark on this process. When Dave Moreno, the associate director of Road Service at CAA Niagara, started at the club in 2018, he was pleased to learn that the club had so much data he could delve into and analyze. With his analysis, he set out a goal of reducing costs and improving operations in Road Service. To get a working set of reports for analysis, Dave met with Richard Johnson (the Power BI reporting analyst) every other week and presented him with a list of questions he wanted answered. Richard would then build the report and pass it back to Dave which often sparked a new round of questions and additional visualization requests. This process has resulted in a suite of Power BI reports that Dave can filter and slice to provide business insights.
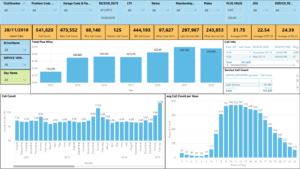
Power BI Example Report – Emergency Road Service
Benefits Achieved
Power BI, combined with the rich data provided through the AXIS BI Support solution, has allowed CAA Niagara to realize many benefits, including:
- Significant time savings – using Power BI with the data in their Microsoft SQL Server ® database, they were able to build in weeks something that would have taken them months to build previously.
- A self-serve environment – admin staff, supervisors, managers, and senior leaders can all access appropriate reports easily at the office, from home, and even on their mobile devices. They can leverage Power BI visualizations to find anomalies in the data and can then dig deeper to understand the cause without having to make additional requests for data from the IT Department.
- Data Consolidation – previously the club had over 100 separate static reports available to management using SQL reports. A single Power BI report often consolidates the information from a dozen SQL reports into one Power BI report. This makes the information easier to find and manage.
- Ease of use, transparency, and trust in the data – create reports that are easy to read and understand. Power BI allows users to easily drill down to view the information that make up the reports. They can see the data themselves, instead of relying on summary / detail reports that others have built. This transparency increases trust in the data and empowers management to make informed decisions.
- New insights
- Prove or disprove theories that employees have by removing guesswork.
- Identify where processes are inconsistent; by making processes consistent, the data also becomes more meaningful.
- Look at the operations from different angles and find inefficiencies.
- Employee Renewal Rate. A new metric that CAA Niagara has defined measures the renewal rates of members who have had an interaction with an employee the previous year. This KPI reinforces the notion that every interaction the employees have with members has an impact on their likelihood to renew.
Key to Success
CAA Niagara’s accomplishments in under a year are significant. The club attributes the following key steps to their success:
- Obtain executive buy-in. Significant time and financial resources are required.
- Communication and collaboration. Meet with Strategic Business Unit (SBU) leaders regularly throughout the process. Have them review the reports throughout the creation process and make sure they have a good understanding of their data. These regular meetings ensure efficiency and accuracy in the reports.
- Ensure the BI Report maker has strong SQL and programming skills, or that they have access to people who do have these skills.
Lessons Learned
Throughout this process, CAA Niagara realized it is necessary to understand what events may have affected the data. A sudden spike or dip in a report may not indicate great success or failure; sometimes it represents a change in the data itself. For example, the addition of pre-existing products and services to Lifetime Value and Product Index.
Stay focused. Prioritize your data collection efforts and reporting needs. Implementing a BI solution requires commitment and dedicated resources. Keep the momentum going. You can’t afford to be distracted and come back to this later; if you do, you’ll have lost valuable time and precious knowledge.
BI is not an IT responsibility, though at first it will feel like it. The collection, secure storage, and accessibility of data is certainly within IT’s scope, but when it comes to data interpretation, action and associated results, this requires leadership from the business units themselves. They are accountable for leveraging the insights gained from BI and driving change to produce results.
What’s Next for CAA Niagara?
Based on their analysis, operational changes were implemented in the Road Service department, and they are now able to begin evaluating the impact of these changes (e.g. cost savings & member satisfaction) and adjust as needed. They have recently hired a business analyst to ensure continued focus on BI. The club plans to create a BI Governance committee to help provide structure and clarity to the entire BI process.
CAA Niagara has been serving Members in the Niagara Region for over 100 years. They have been a user of the AXIS system and all three of its major components (Member Relationship Management (MRM), Travel, and Road Service) for the past 21 years.
Until now, CAA Niagara’s business leaders have relied on pre-defined reports within AXIS and their IT department to generate new reports. It would take time for IT to deliver a new report and they would often need to explain outlying results before the report could be fully utilized.
To deliver information more effectively, Kevin Ruthven, Director of IT, decided to invest resources into putting in place a new and improved reporting solution. The solution would provide the business a self-serve environment where they could slice and dice the information to provide broader and deeper insights into their operations.